Viewing Images#
Read in Datasets#
Subset of an AVIRIS image
import rasterio
# Import example AVIRIS data
with rasterio.open('./data/subset_f180628t01p00r02_corr_v1k1_img') as src:
    metadata = src.meta
    bands = src.read()
Viewing images#
You’ll notice because it’s visualizing a numpy array not a rasterio geospatial object that the axis isn’t in lat/long, it’s in pixel number.
Choosing a colormap (with a list of color map names a quarter of the way down)
import matplotlib.pyplot as plt
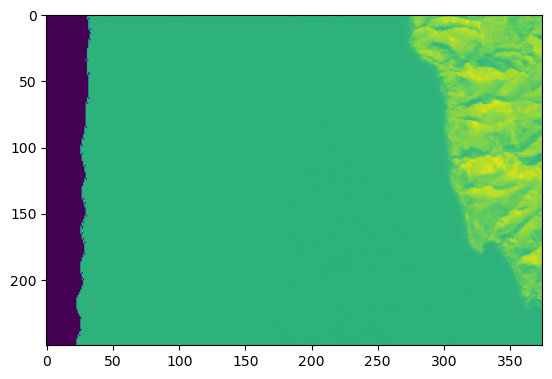
# plt.imshow() hands only one band at a time (or 3 bands, in the case of rgb images)
plt.imshow(bands[100])
<matplotlib.image.AxesImage at 0x1178f9cf0>
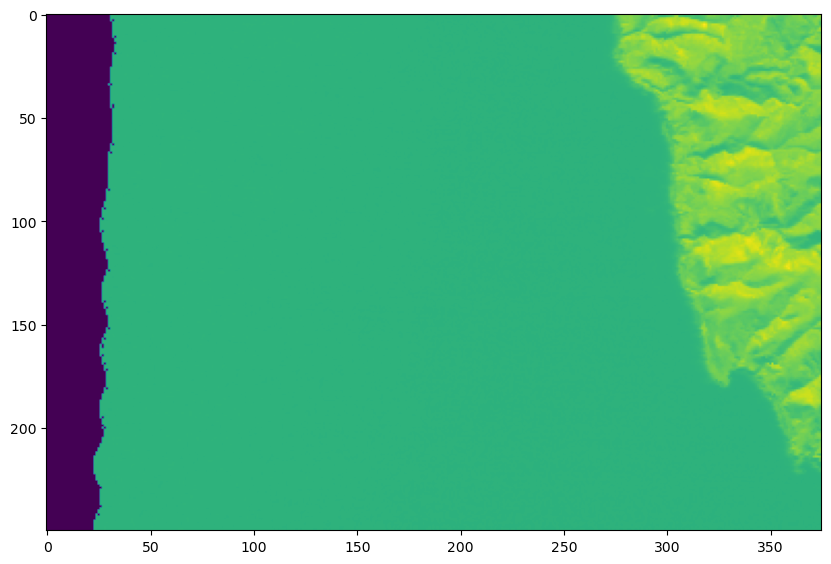
# make the plot bigger
plt.rcParams["figure.figsize"] = (10,10)
plt.imshow(bands[100])
<matplotlib.image.AxesImage at 0x117a997e0>
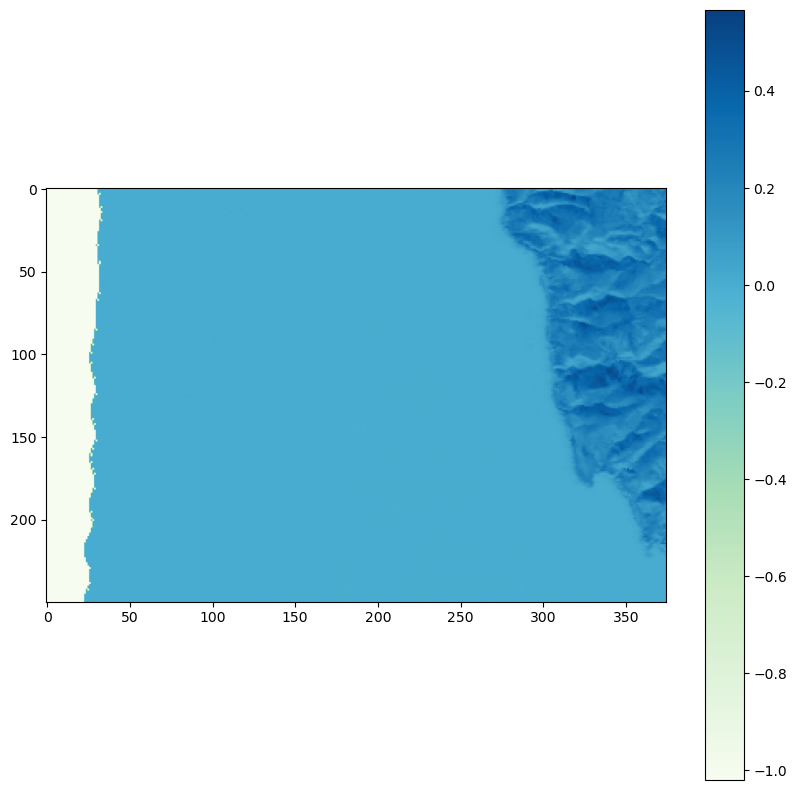
# Change the color, add a color bar
plt.imshow(bands[100], cmap='GnBu')
plt.colorbar()
<matplotlib.colorbar.Colorbar at 0x117b724a0>
import numpy.ma as ma
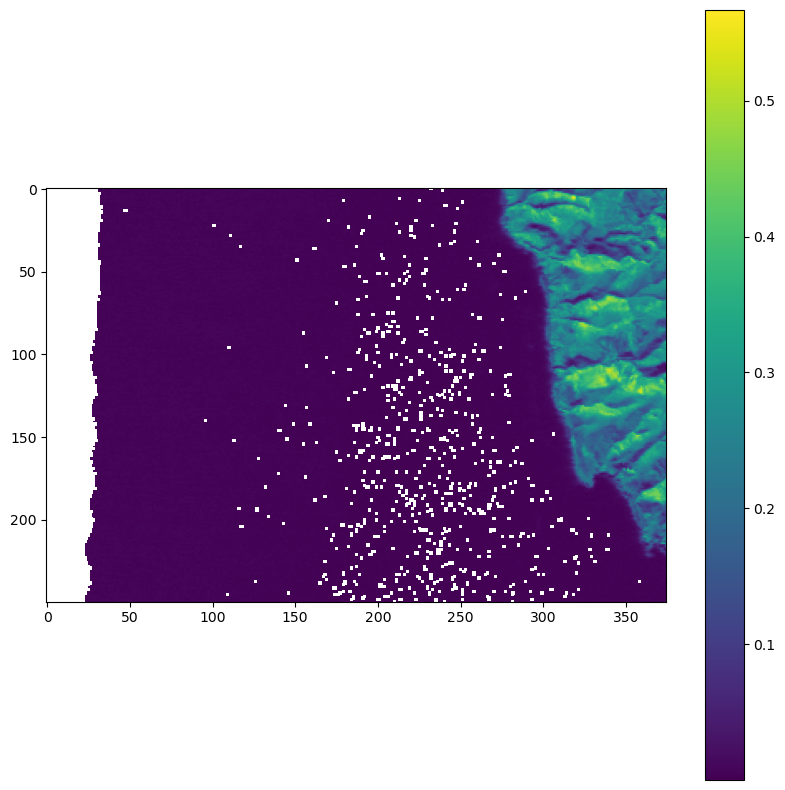
# Mask out invalid numbers, (but be sure to make sure this is scientifically sound first!)
bands_masked = ma.masked_where(bands < 0, bands )
plt.imshow(bands_masked[100])
plt.colorbar()
<matplotlib.colorbar.Colorbar at 0x117c2fd00>