geopandas#
Lesson Content
geopandasvs.pandasspatial data operations
reprojecting to meters
filtering a geodataframe by a vector
Context#
🐼➕🌐 = 🚀🎉❤️
We’ve used pandas to help us get the most out of our csv and excel data. We talked yesterday about how spatial data is stored and organized. Today we combine both worlds with geopandas, an extenions of pandas specific to spatial data.
Just like how we saw that converting datetime strings to Python datetime objects, converting our latitudes and longitudes to points allows us to use a world more of spatial data analysis techniques. It’s so exciting!
geopandas#
GeoPandas is an extension of Pandas. GeoDataFrames have the same row, column structure with indexes that are accessed in the same way as Pandas. The difference is that they also have a geometry column.
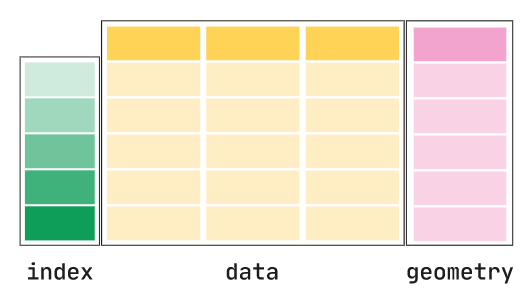
Let’s look at an example geodataframe that comes pre-loaded on geopandas.
import geopandas as gpd
gpd.read_file(gpd.datasets.get_path('naturalearth_lowres'))
/var/folders/p8/985fq4dx1356qtcv5dd4zgyr0000gn/T/ipykernel_20876/309957874.py:1: FutureWarning: The geopandas.dataset module is deprecated and will be removed in GeoPandas 1.0. You can get the original 'naturalearth_lowres' data from https://www.naturalearthdata.com/downloads/110m-cultural-vectors/.
  gpd.read_file(gpd.datasets.get_path('naturalearth_lowres'))
| pop_est | continent | name | iso_a3 | gdp_md_est | geometry | |
|---|---|---|---|---|---|---|
| 0 | 889953.0 | Oceania | Fiji | FJI | 5496 | MULTIPOLYGON (((180.00000 -16.06713, 180.00000... |
| 1 | 58005463.0 | Africa | Tanzania | TZA | 63177 | POLYGON ((33.90371 -0.95000, 34.07262 -1.05982... |
| 2 | 603253.0 | Africa | W. Sahara | ESH | 907 | POLYGON ((-8.66559 27.65643, -8.66512 27.58948... |
| 3 | 37589262.0 | North America | Canada | CAN | 1736425 | MULTIPOLYGON (((-122.84000 49.00000, -122.9742... |
| 4 | 328239523.0 | North America | United States of America | USA | 21433226 | MULTIPOLYGON (((-122.84000 49.00000, -120.0000... |
| ... | ... | ... | ... | ... | ... | ... |
| 172 | 6944975.0 | Europe | Serbia | SRB | 51475 | POLYGON ((18.82982 45.90887, 18.82984 45.90888... |
| 173 | 622137.0 | Europe | Montenegro | MNE | 5542 | POLYGON ((20.07070 42.58863, 19.80161 42.50009... |
| 174 | 1794248.0 | Europe | Kosovo | -99 | 7926 | POLYGON ((20.59025 41.85541, 20.52295 42.21787... |
| 175 | 1394973.0 | North America | Trinidad and Tobago | TTO | 24269 | POLYGON ((-61.68000 10.76000, -61.10500 10.890... |
| 176 | 11062113.0 | Africa | S. Sudan | SSD | 11998 | POLYGON ((30.83385 3.50917, 29.95350 4.17370, ... |
177 rows × 6 columns
What is the data type of the geometry column? It’s shapely objects! They are Polygons, like we say yesterday in the Spatial Data lecture.
Converting our pandas dataframe to a GeoDataFrame#
geodataframe = pandas dataframe + geometry column of shapely objects
import pandas as pd
import geopandas as gpd
import numpy as np

# This line shortens the output
pd.set_option('display.max_rows', 10)
pd.set_option('display.max_columns', 8)
This dataset holds data from the firex campaign. We will be using just a few columns for this lesson.
firex_filepath = "./data/Copy of SARP 2009 to 2020 sent to Alex with plotting.xlsx"
firex = pd.read_excel(firex_filepath, 'data')
firex = firex[['Can#', 'Jday', 'Latitude', 'Longitude', 'State', 'CH4 (ppmv)',
       'CO (ppbv)', 'CO2_ppm', 'OCS (MS)', 'DMS (MS)']].iloc[:4490]
firex
| Can# | Jday | Latitude | Longitude | ... | CO (ppbv) | CO2_ppm | OCS (MS) | DMS (MS) | |
|---|---|---|---|---|---|---|---|---|---|
| 0 | 8198 | 202.0 | 35.000000 | -118.943333 | ... | -999.0 | -999.0 | 518.0 | -888.0 |
| 1 | 7167 | 202.0 | 35.081667 | -119.101000 | ... | -999.0 | -999.0 | 519.0 | -888.0 |
| 2 | 6354 | 202.0 | 35.170000 | -119.233333 | ... | -999.0 | -999.0 | 495.0 | 14.0 |
| 3 | 7226 | 202.0 | 35.346667 | -119.381667 | ... | -999.0 | -999.0 | 505.0 | 11.9 |
| 4 | 6269 | 202.0 | 35.438333 | -119.433333 | ... | -999.0 | -999.0 | 487.0 | 17.4 |
| ... | ... | ... | ... | ... | ... | ... | ... | ... | ... |
| 4485 | 5090 | NaN | 29.717200 | -95.341600 | ... | -999.0 | -999.0 | 553.0 | 4.0 |
| 4486 | 5028 | NaN | 29.717200 | -95.341600 | ... | -999.0 | -999.0 | 528.0 | 5.5 |
| 4487 | 5017 | NaN | 29.717200 | -95.341600 | ... | -999.0 | -999.0 | 583.0 | 8.6 |
| 4488 | 5091 | NaN | 29.717200 | -95.341600 | ... | -999.0 | -999.0 | 534.0 | 3.9 |
| 4489 | 5046 | NaN | 29.717200 | -95.341600 | ... | -999.0 | -999.0 | 530.0 | 9.1 |
4490 rows × 10 columns
# Drop columns where Latitude or Longitude are nan
firex = firex[firex['Longitude'].notna()]
# Replace both nan values with np.nan
firex = firex.replace({-999: np.nan, -888: np.nan})
If you have string latitude and longitude columns (as in this dataframe) there is a function prebuilt for that common case: gpd.points_from_xy()
gpd.points_from_xy(firex['Longitude'], firex['Latitude'])
<GeometryArray>
[    <POINT (-118.943 35)>, <POINT (-119.101 35.082)>,
  <POINT (-119.233 35.17)>, <POINT (-119.382 35.347)>,
 <POINT (-119.433 35.438)>, <POINT (-119.433 35.567)>,
 <POINT (-119.442 35.657)>,  <POINT (-119.45 35.757)>,
 <POINT (-119.457 35.857)>,  <POINT (-119.45 35.958)>,
 ...
  <POINT (-95.342 29.717)>,  <POINT (-95.342 29.717)>,
  <POINT (-95.342 29.717)>,  <POINT (-95.342 29.717)>,
  <POINT (-95.342 29.717)>,  <POINT (-95.342 29.717)>,
  <POINT (-95.342 29.717)>,  <POINT (-95.342 29.717)>,
  <POINT (-95.342 29.717)>,  <POINT (-95.342 29.717)>]
Length: 4405, dtype: geometry
geoFIREX = gpd.GeoDataFrame(
    firex, geometry=gpd.points_from_xy(firex['Longitude'], firex['Latitude']),
    crs='epsg:4326')
geoFIREX
| Can# | Jday | Latitude | Longitude | ... | CO2_ppm | OCS (MS) | DMS (MS) | geometry | |
|---|---|---|---|---|---|---|---|---|---|
| 0 | 8198 | 202.0 | 35.000000 | -118.943333 | ... | NaN | 518.0 | NaN | POINT (-118.94333 35.00000) |
| 1 | 7167 | 202.0 | 35.081667 | -119.101000 | ... | NaN | 519.0 | NaN | POINT (-119.10100 35.08167) |
| 2 | 6354 | 202.0 | 35.170000 | -119.233333 | ... | NaN | 495.0 | 14.0 | POINT (-119.23333 35.17000) |
| 3 | 7226 | 202.0 | 35.346667 | -119.381667 | ... | NaN | 505.0 | 11.9 | POINT (-119.38167 35.34667) |
| 4 | 6269 | 202.0 | 35.438333 | -119.433333 | ... | NaN | 487.0 | 17.4 | POINT (-119.43333 35.43833) |
| ... | ... | ... | ... | ... | ... | ... | ... | ... | ... |
| 4485 | 5090 | NaN | 29.717200 | -95.341600 | ... | NaN | 553.0 | 4.0 | POINT (-95.34160 29.71720) |
| 4486 | 5028 | NaN | 29.717200 | -95.341600 | ... | NaN | 528.0 | 5.5 | POINT (-95.34160 29.71720) |
| 4487 | 5017 | NaN | 29.717200 | -95.341600 | ... | NaN | 583.0 | 8.6 | POINT (-95.34160 29.71720) |
| 4488 | 5091 | NaN | 29.717200 | -95.341600 | ... | NaN | 534.0 | 3.9 | POINT (-95.34160 29.71720) |
| 4489 | 5046 | NaN | 29.717200 | -95.341600 | ... | NaN | 530.0 | 9.1 | POINT (-95.34160 29.71720) |
4405 rows × 11 columns
📝 Check your understanding
What is the datatype of the geometry column?
A) integer
B) datetime
C) float
D) shapely Point
E) list
Spatial data operations#
By using shapely points we get the advantages of spatial operations built into our DataFrame.
Example question: How far are all of my data points from Mt. St. Helens?
from shapely.geometry import Point
mt_st_helens = Point(-122.1956, 46.1914)
geoFIREX['geometry'].distance(mt_st_helens)
/var/folders/p8/985fq4dx1356qtcv5dd4zgyr0000gn/T/ipykernel_20876/3190452269.py:1: UserWarning: Geometry is in a geographic CRS. Results from 'distance' are likely incorrect. Use 'GeoSeries.to_crs()' to re-project geometries to a projected CRS before this operation.

  geoFIREX['geometry'].distance(mt_st_helens)
0       11.654384
1       11.532681
2       11.412549
3       11.203859
4       11.102187
          ...
4485    31.504549
4486    31.504549
4487    31.504549
4488    31.504549
4489    31.504549
Length: 4405, dtype: float64
Reprojecting to meters#
Reprojecting a GeoDataFrame is really smooth, it only takes one .to_crs() method. The only thing to be careful of is to make sure first that you have a crs set for your dataframe. If you don’t and your points are in lat/lon then EPSG:4326 is the CRS you should give it.
# Set the CRS, if you didn't do it when you read in the data
geoFIREX = geoFIREX.set_crs(epsg=4326)
print(geoFIREX.crs)
EPSG:4326
geoFIREX['geometry']
0       POINT (-118.94333 35.00000)
1       POINT (-119.10100 35.08167)
2       POINT (-119.23333 35.17000)
3       POINT (-119.38167 35.34667)
4       POINT (-119.43333 35.43833)
                   ...
4485     POINT (-95.34160 29.71720)
4486     POINT (-95.34160 29.71720)
4487     POINT (-95.34160 29.71720)
4488     POINT (-95.34160 29.71720)
4489     POINT (-95.34160 29.71720)
Name: geometry, Length: 4405, dtype: geometry
geoFIREXprojcrs = geoFIREX.to_crs(epsg=3857)
geoFIREXprojcrs['geometry'].distance(mt_st_helens) / 1000
0       13879.867483
1       13899.942512
2       13917.606473
3       13940.611137
4       13949.878850
            ...
4485    11165.245602
4486    11165.245602
4487    11165.245602
4488    11165.245602
4489    11165.245602
Length: 4405, dtype: float64
📝 Check your understanding
Define a shapely point that represents the SARP Conference room. Calculate the distance from the SARP conference room to each point in the FIREX dataset.
📝 Check your understanding
Say I run the block of code geoFIREX.to_crs(epsg=3857) and get the following error:
ValueError: Cannot transform naive geometries. Please set a crs on the object first.
What is likely my problem?
Quick Plots#
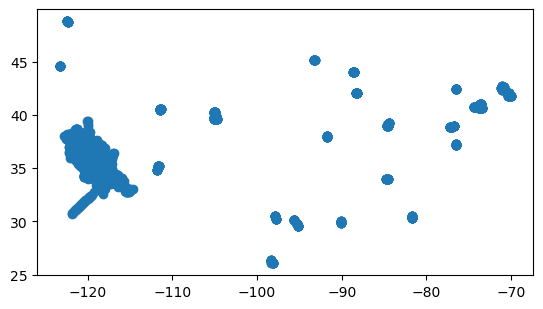
One great feature of the geodataframes is that they have a .plot() method that can be used to view the general distribution of data.
geoFIREX.plot()
<Axes: >
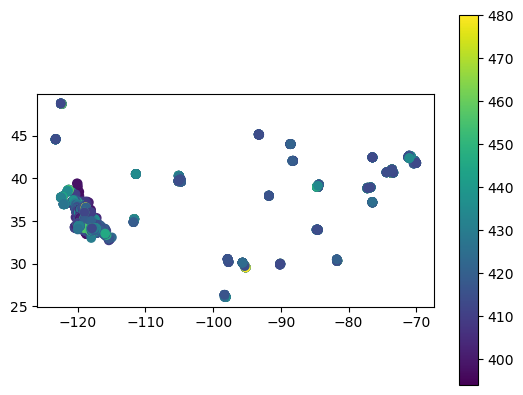
You can use matplotlib arguments to begin to modify your graph.
geoFIREX.plot(column='CO2_ppm', legend=True, vmax=480)
<Axes: >
Another built-in method for viewing data is .explore(). In order to use .explore() the dataframe must have a CRS set. For more features with the .explore() method check out the geopandas user guide. You can see the available basemaps on the docs page for .explore() under the tiles argument.
geoFIREX.explore(tiles="OpenStreetMap")
# And example of using a different basemap
# geoFIREX.explore(tiles="http://c.tile.stamen.com/watercolor/{z}/{x}/{y}.jpg", attr="Stamen Watercolor")
Filtering a geodataframe by a vector#
Let’s say we want to know how many measurements were taken within 150 km of mt. st. helens. We start with our mt. st. helens point and then we buffer it.
# convert our mt st helens 4326 point to 3857
from pyproj import Transformer
from shapely.ops import transform
uc_irvine = Point(-117.835, 33.644)
t = Transformer.from_crs('epsg:4326', 'epsg:3857', always_xy=True).transform
uc_irvine_projcrs = transform(t, uc_irvine)
# Buffer the point
buff_uc_irvine = uc_irvine_projcrs.buffer(10000)
geoFIREXprojcrs['geometry'].intersects(buff_uc_irvine)
0       False
1       False
2       False
3       False
4       False
        ...
4485    False
4486    False
4487    False
4488    False
4489    False
Length: 4405, dtype: bool
# Notice that we indexed one dataframe by a different dataframe
geoFIREX[geoFIREXprojcrs['geometry'].intersects(buff_uc_irvine)]
| Can# | Jday | Latitude | Longitude | ... | CO2_ppm | OCS (MS) | DMS (MS) | geometry | |
|---|---|---|---|---|---|---|---|---|---|
| 1779 | 9068 | 174.0 | 33.667200 | -117.847000 | ... | 409.0 | 570.0 | NaN | POINT (-117.84700 33.66720) |
| 2206 | 6343 | 177.0 | 33.615195 | -117.784866 | ... | 414.0 | 593.0 | 0.5 | POINT (-117.78487 33.61519) |
| 2234 | 9309 | 177.0 | 33.640604 | -117.806361 | ... | 419.0 | 572.0 | NaN | POINT (-117.80636 33.64060) |
3 rows × 11 columns
📝 Check your understanding
What is the following code doing?
palmdale = Point(-118.075, 34.61)
t = Transformer.from_crs('epsg:4326', 'epsg:3857', always_xy=True).transform
palmdale_projcrs = transform(t, palmdale)
A) Converting a DataFrame called palmdale into a projected CRS
B) Converting a DataFrame called palmdale into a geographic CRS
C) Converting a Point called palmdale into a projected CRS
D) Converting a Point called palmdale into a geographic CRS
E) Intersecting the palmdale objet with the object t
📝 Check your understanding
I want to buffer the mt_st_helens point by 10000m. What is the problem with the following code I’ve written below to do that?
Point(-122.1956, 46.1914).buffer(10000)