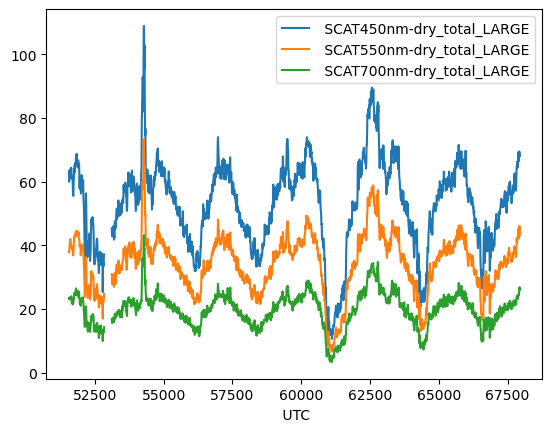
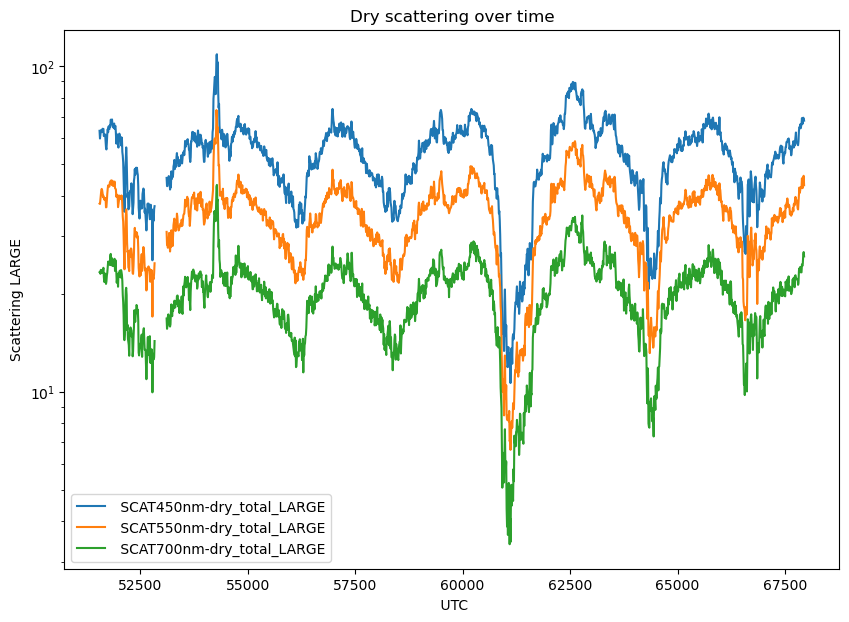
Plot with multiple lines and a log axis#
This example demonstrates:
plotting multiple columns from a pandas dataframe into a line plot
using a log axis
import matplotlib.pyplot as plt
import pandas as pd
import numpy as np
pd.set_option('display.max_columns', 8)
Data opening and discovery#
discoveraq_all = pd.read_csv('../lessons/tabular_data/data/discoveraq-mrg10-p3b_merge_20140720_R2.ict', skiprows=182)
discoveraq_all
| UTC | JDAY | INDEX | FLIGHT | ... | C8-alkylbenzenes_MixingRatio | C9-alkylbenzenes_MixingRatio | Monoterpenes_MixingRatio | BC_mass | |
|---|---|---|---|---|---|---|---|---|---|
| 0 | 50955 | 201 | 20001 | 2 | ... | -9999999.0 | -9999999.0 | -9999999.0 | -9999999 |
| 1 | 50965 | 201 | 20002 | 2 | ... | -9999999.0 | -9999999.0 | -9999999.0 | -9999999 |
| 2 | 50975 | 201 | 20003 | 2 | ... | -9999999.0 | -9999999.0 | -9999999.0 | -9999999 |
| 3 | 50985 | 201 | 20004 | 2 | ... | -9999999.0 | -9999999.0 | -9999999.0 | -9999999 |
| 4 | 50995 | 201 | 20005 | 2 | ... | -9999999.0 | -9999999.0 | -9999999.0 | -9999999 |
| ... | ... | ... | ... | ... | ... | ... | ... | ... | ... |
| 1724 | 68195 | 201 | 21725 | 2 | ... | -9999999.0 | -9999999.0 | -9999999.0 | -9999999 |
| 1725 | 68205 | 201 | 21726 | 2 | ... | -9999999.0 | -9999999.0 | -9999999.0 | -9999999 |
| 1726 | 68215 | 201 | 21727 | 2 | ... | -9999999.0 | -9999999.0 | -9999999.0 | -9999999 |
| 1727 | 68225 | 201 | 21728 | 2 | ... | -9999999.0 | -9999999.0 | -9999999.0 | -9999999 |
| 1728 | 68235 | 201 | 21729 | 2 | ... | -9999999.0 | -9999999.0 | -9999999.0 | -9999999 |
1729 rows × 138 columns
Data subsetting and cleaning#
discover_scat = discoveraq_all[[' UTC', ' SCAT450nm-dry_total_LARGE',
                            ' SCAT550nm-dry_total_LARGE', ' SCAT700nm-dry_total_LARGE']]
# Clean nodata value
discover_scat = discover_scat.replace(-9999999, np.nan)
# Set UTC as an index so that pandas knows it should be the x axis
discover_scat = discover_scat.set_index(' UTC')
Plotting#
# plot using the built in pandas function
discover_scat.plot()
<Axes: xlabel=' UTC'>

fig, ax = plt.subplots()
fig.set_size_inches(10, 7)

# plot the same pandas plot on a matplotlib specified axis
discover_scat.plot(ax=ax)

# Set the y axis to be a log scale
ax.set_yscale('log')

# Add labels
ax.set_title('Dry scattering over time')
ax.set_ylabel('Scattering LARGE')
Text(0, 0.5, 'Scattering LARGE')

