Filtering and groupby#
Lesson Content
🗑️ Filtering
📍 Setting an Index
🔪 Groupby
Context#
We spent yesterday getting comfortable in pandas. We opened some data, explored it, and ran a few functions. Today we are going to expand on what we are doing by learning a few powerful ways to interrogate our data – filtering and grouping. These manipulations help us get at the specific part of a dataset that we need.
Loading our data#
We’ll be using the same USGS water dataset as lesson 3. Here we read and pre-process the data.
import pandas as pd

# This line shortens the output
pd.set_option('display.max_rows', 10)
# Read in the data
water_vars = pd.read_csv('./data/englewood_3_12_21_usgs_water.tsv', sep='\t', skiprows=30)
# There are a lot of variables here, so let's shorten our dataframe to a few variables
water_vars = water_vars[['datetime', '210920_00060', '210922_00010', '210924_00300', '210925_00400']]
# Get rid of the first row of hard-coded datatype info
water_vars = water_vars.drop(0)
# Rename the columns from their USGS codes to more human-readible names
name_codes = {'210920_00060': 'discharge','210922_00010': 'temperature', '210924_00300': 'dissolved oxygen', '210925_00400': 'pH'}
water_vars = water_vars.rename(columns=name_codes)
# Convert columns with numbers to a numeric type
water_vars['discharge'] = pd.to_numeric(water_vars['discharge'])
water_vars['temperature'] = pd.to_numeric(water_vars['temperature'])
water_vars['dissolved oxygen'] = pd.to_numeric(water_vars['dissolved oxygen'])
water_vars['pH'] = pd.to_numeric(water_vars['pH'])
Today I’m also going to add two fake columns of data, “dam release” and “safety level”, that will help us as we go through some of the new concepts.
import random
water_vars['dam release'] = [random.choice([True, False]) for x in range(len(water_vars))]
water_vars['safety level'] = [random.choice(['low', 'medium', 'high']) for x in range(len(water_vars))]
water_vars
| datetime | discharge | temperature | dissolved oxygen | pH | dam release | safety level | |
|---|---|---|---|---|---|---|---|
| 1 | 2021-03-12 00:00 | 44.5 | 8.1 | 8.3 | 8.1 | False | high |
| 2 | 2021-03-12 00:15 | 44.5 | 8.1 | 8.2 | 8.1 | True | high |
| 3 | 2021-03-12 00:30 | 44.5 | 8.1 | 8.2 | 8.1 | True | high |
| 4 | 2021-03-12 00:45 | 44.5 | 8.1 | 8.1 | 8.1 | True | medium |
| 5 | 2021-03-12 01:00 | 44.5 | 8.1 | 8.1 | 8.1 | False | medium |
| ... | ... | ... | ... | ... | ... | ... | ... |
| 142 | 2021-03-13 11:15 | 42.6 | 6.7 | 9.8 | 7.9 | True | high |
| 143 | 2021-03-13 11:30 | 42.6 | 6.7 | 9.9 | 7.9 | True | medium |
| 144 | 2021-03-13 11:45 | 42.6 | 6.7 | 10.2 | 7.9 | False | medium |
| 145 | 2021-03-13 12:00 | 46.5 | 6.7 | 10.3 | 7.9 | True | medium |
| 146 | 2021-03-13 12:15 | NaN | 6.6 | 10.3 | 7.9 | False | high |
146 rows × 7 columns
Filtering#
So let’s start with a general question. We learned about booleans and comparisons on Monday of this week.
What would happen if we used a comparison on a pandas dataframe?
Give this a think:
water_vars['discharge'] == 8.1
The answer? We get another dataframe. This dataframe is the size and shape as the thing used in comparison, but it is full of Boolean values telling us if the comparsion was true.
So what is the use of a list of booleans? Let’s start with a simplified list of booleans and experiment.
import random
# Create just a list of booleans, instead of a full dataframe
random_booleans = [random.choice([True, False]) for x in range(146)]
# Use the list of booleans with square brackets, sort of like a key in a dictionary
water_vars[random_booleans]
| datetime | discharge | temperature | dissolved oxygen | pH | dam release | safety level | |
|---|---|---|---|---|---|---|---|
| 1 | 2021-03-12 00:00 | 44.5 | 8.1 | 8.3 | 8.1 | False | high |
| 3 | 2021-03-12 00:30 | 44.5 | 8.1 | 8.2 | 8.1 | True | high |
| 4 | 2021-03-12 00:45 | 44.5 | 8.1 | 8.1 | 8.1 | True | medium |
| 5 | 2021-03-12 01:00 | 44.5 | 8.1 | 8.1 | 8.1 | False | medium |
| 6 | 2021-03-12 01:15 | 44.5 | 8.1 | 8.1 | 8.1 | False | medium |
| ... | ... | ... | ... | ... | ... | ... | ... |
| 133 | 2021-03-13 09:00 | 46.5 | 6.8 | 8.9 | 7.8 | False | medium |
| 134 | 2021-03-13 09:15 | 46.5 | 6.8 | 9.0 | 7.9 | True | low |
| 140 | 2021-03-13 10:45 | 44.5 | 6.7 | 9.6 | 7.9 | True | high |
| 141 | 2021-03-13 11:00 | 42.6 | 6.7 | 9.7 | 7.9 | False | medium |
| 142 | 2021-03-13 11:15 | 42.6 | 6.7 | 9.8 | 7.9 | True | high |
68 rows × 7 columns
That returned only the rows where the value in the list was True!
This is exciting, because this is the basis for filtering rows in pandas. Trying it again with our conditional statement from above water_vars['dissolved oxygen'] == 8.2:
# make a dataframe indicating where dissolved oxygen == 8.2
boolean_dataframe = water_vars['dissolved oxygen'] == 8.2
# returns only the rows where dissolved oxygen == 8.2
water_vars[boolean_dataframe]
| datetime | discharge | temperature | dissolved oxygen | pH | dam release | safety level | |
|---|---|---|---|---|---|---|---|
| 2 | 2021-03-12 00:15 | 44.5 | 8.1 | 8.2 | 8.1 | True | high |
| 3 | 2021-03-12 00:30 | 44.5 | 8.1 | 8.2 | 8.1 | True | high |
| 27 | 2021-03-12 06:30 | 48.5 | 7.1 | 8.2 | 7.9 | False | low |
| 28 | 2021-03-12 06:45 | 48.5 | 7.0 | 8.2 | 7.9 | True | high |
| 29 | 2021-03-12 07:00 | 48.5 | 7.0 | 8.2 | 7.9 | False | low |
| ... | ... | ... | ... | ... | ... | ... | ... |
| 121 | 2021-03-13 06:00 | 46.5 | 7.2 | 8.2 | 7.9 | True | high |
| 122 | 2021-03-13 06:15 | 46.5 | 7.2 | 8.2 | 7.9 | False | medium |
| 123 | 2021-03-13 06:30 | 46.5 | 7.1 | 8.2 | 7.9 | False | high |
| 124 | 2021-03-13 06:45 | 46.5 | 7.1 | 8.2 | 7.9 | True | high |
| 125 | 2021-03-13 07:00 | 46.5 | NaN | 8.2 | 7.9 | False | medium |
24 rows × 7 columns
While there are several steps, this process is most commonly done in a single step:
water_vars[water_vars['dissolved oxygen'] == 8.2]
| datetime | discharge | temperature | dissolved oxygen | pH | dam release | safety level | |
|---|---|---|---|---|---|---|---|
| 2 | 2021-03-12 00:15 | 44.5 | 8.1 | 8.2 | 8.1 | True | high |
| 3 | 2021-03-12 00:30 | 44.5 | 8.1 | 8.2 | 8.1 | True | high |
| 27 | 2021-03-12 06:30 | 48.5 | 7.1 | 8.2 | 7.9 | False | low |
| 28 | 2021-03-12 06:45 | 48.5 | 7.0 | 8.2 | 7.9 | True | high |
| 29 | 2021-03-12 07:00 | 48.5 | 7.0 | 8.2 | 7.9 | False | low |
| ... | ... | ... | ... | ... | ... | ... | ... |
| 121 | 2021-03-13 06:00 | 46.5 | 7.2 | 8.2 | 7.9 | True | high |
| 122 | 2021-03-13 06:15 | 46.5 | 7.2 | 8.2 | 7.9 | False | medium |
| 123 | 2021-03-13 06:30 | 46.5 | 7.1 | 8.2 | 7.9 | False | high |
| 124 | 2021-03-13 06:45 | 46.5 | 7.1 | 8.2 | 7.9 | True | high |
| 125 | 2021-03-13 07:00 | 46.5 | NaN | 8.2 | 7.9 | False | medium |
24 rows × 7 columns
📝 Check your understanding
Write a cell of code that returns only the rows of the water_vars dataframe where discharge is less than or equal to 46.
Using and and or#
You can continue to make your filter more specific by using multiple filters. The syntax that we used in the first lesson was:
num_cats = 3
num_dogs = 2
print(num_cats > 2 and num_dogs > 2)
print(num_cats > 2 or num_dogs > 2)
False
True
While the meaning of and and or is the same in pandas, the syntax is slightly different. In pandas:
Python |
Pandas |
|---|---|
and |
& |
or |
| |
You also have to be sure to wrap each individual conditional statement in parenthesis ().
# Cells where pH < 8 and dam release was True
water_vars[(water_vars['pH'] < 8) & (water_vars['dam release'] == True)]
| datetime | discharge | temperature | dissolved oxygen | pH | dam release | safety level | |
|---|---|---|---|---|---|---|---|
| 28 | 2021-03-12 06:45 | 48.5 | 7.0 | 8.2 | 7.9 | True | high |
| 31 | 2021-03-12 07:30 | 48.5 | 6.9 | 8.3 | 7.9 | True | high |
| 33 | 2021-03-12 08:00 | 48.5 | 6.8 | 8.4 | 7.9 | True | medium |
| 34 | 2021-03-12 08:15 | 48.5 | 6.7 | 8.4 | 7.9 | True | low |
| 36 | 2021-03-12 08:45 | 46.5 | 6.7 | 8.6 | 7.9 | True | low |
| ... | ... | ... | ... | ... | ... | ... | ... |
| 139 | 2021-03-13 10:30 | 44.5 | 6.8 | 9.6 | 7.9 | True | low |
| 140 | 2021-03-13 10:45 | 44.5 | 6.7 | 9.6 | 7.9 | True | high |
| 142 | 2021-03-13 11:15 | 42.6 | 6.7 | 9.8 | 7.9 | True | high |
| 143 | 2021-03-13 11:30 | 42.6 | 6.7 | 9.9 | 7.9 | True | medium |
| 145 | 2021-03-13 12:00 | 46.5 | 6.7 | 10.3 | 7.9 | True | medium |
29 rows × 7 columns
water_vars[(water_vars['pH'] < 8) | (water_vars['dam release'] == True)]
| datetime | discharge | temperature | dissolved oxygen | pH | dam release | safety level | |
|---|---|---|---|---|---|---|---|
| 2 | 2021-03-12 00:15 | 44.5 | 8.1 | 8.2 | 8.1 | True | high |
| 3 | 2021-03-12 00:30 | 44.5 | 8.1 | 8.2 | 8.1 | True | high |
| 4 | 2021-03-12 00:45 | 44.5 | 8.1 | 8.1 | 8.1 | True | medium |
| 9 | 2021-03-12 02:00 | 44.5 | 8.0 | 8.0 | 8.1 | True | low |
| 12 | 2021-03-12 02:45 | 44.5 | 7.9 | 7.9 | 8.1 | True | medium |
| ... | ... | ... | ... | ... | ... | ... | ... |
| 142 | 2021-03-13 11:15 | 42.6 | 6.7 | 9.8 | 7.9 | True | high |
| 143 | 2021-03-13 11:30 | 42.6 | 6.7 | 9.9 | 7.9 | True | medium |
| 144 | 2021-03-13 11:45 | 42.6 | 6.7 | 10.2 | 7.9 | False | medium |
| 145 | 2021-03-13 12:00 | 46.5 | 6.7 | 10.3 | 7.9 | True | medium |
| 146 | 2021-03-13 12:15 | NaN | 6.6 | 10.3 | 7.9 | False | high |
98 rows × 7 columns
There is more than one way to do this type of filtering in pandas, but it is fine to start with one method and feel really comfortable with it before moving to the others. This article has a pretty nice overview of some other methods.
📝 Check your understanding
How is the following line of code filtering the water_vars dataset?
water_vars[(water_vars['discharge'] <= 46) | (water_vars['dam release'] > 42)]
Setting an Index#
Whether using pandas or excel or a SQL database, the index is an important part of your organization.
The most important part of in index is that it is unique, meaning no two rows of data is allowed to have the same index
This is important for keeping the data organized, not just practically but also conceptually.
One of the powerful components of pandas is that you aren’t required to have a number as the index of a dataframe. Let’s look at this with an example dataframe
grades = pd.DataFrame(
    {
        'name': ['Beatriz S', 'Sara H', 'Joel T', 'Ari T', 'Hassan A'],
        'history': [78, 69, 80, 91, 79],
        'science': [85, 80, 80, 73, 91],
        'music': [81, 81, 90, 73, 89],
    }
)
grades
| name | history | science | music | |
|---|---|---|---|---|
| 0 | Beatriz S | 78 | 85 | 81 |
| 1 | Sara H | 69 | 80 | 81 |
| 2 | Joel T | 80 | 80 | 90 |
| 3 | Ari T | 91 | 73 | 73 |
| 4 | Hassan A | 79 | 91 | 89 |
In this dataframe we have default indexes of 0 -> 4 set. We could pretty smoothly use these if we wanted and just know in our heads that Beatriz is index 0, Sara is index 1 and so on.
Alternatively, we could skip the step of remembering index numbers and just use the names of the students as the index. We do that with the .set_index() method.
grades.set_index('name')
| history | science | music | |
|---|---|---|---|
| name | |||
| Beatriz S | 78 | 85 | 81 |
| Sara H | 69 | 80 | 81 |
| Joel T | 80 | 80 | 90 |
| Ari T | 91 | 73 | 73 |
| Hassan A | 79 | 91 | 89 |
# update the original dataframe with the new index
grades = grades.set_index('name')
.iloc vs. loc#
So now that we have names as indexes, how do we select specific rows?
We can still use the same method we already know, iloc, with an integer index number and we will still get the same result.
grades.iloc[1]
history    69
science    80
music      81
Name: Sara H, dtype: int64
Alternatively we can also use a similar but slightly different method - .loc. .loc allows us to find specific rows based on an index label, not the integer.
grades.loc['Hassan A']
history    79
science    91
music      89
Name: Hassan A, dtype: int64
If you want a deep dive on .iloc vs. .loc this article is for you.
📝 Check your understanding
Write 2 lines of code to get Ari’s grades the grades dataframe. In one line use .iloc and in the other use .loc.
Explain to your partner the difference between .iloc and .loc.
One more example - datetime indices#
To move away from our toy example baack to our real data, we have a great column in the water_vars table just waiting to be an index – datetime.
Dates and times are generally fantastic indices, because, if the world is working in proper order, each moment in time only happens once, meaning their values are unique and they are really common indices.
water_vars = water_vars.set_index('datetime')
water_vars
| discharge | temperature | dissolved oxygen | pH | dam release | safety level | |
|---|---|---|---|---|---|---|
| datetime | ||||||
| 2021-03-12 00:00 | 44.5 | 8.1 | 8.3 | 8.1 | False | high |
| 2021-03-12 00:15 | 44.5 | 8.1 | 8.2 | 8.1 | True | high |
| 2021-03-12 00:30 | 44.5 | 8.1 | 8.2 | 8.1 | True | high |
| 2021-03-12 00:45 | 44.5 | 8.1 | 8.1 | 8.1 | True | medium |
| 2021-03-12 01:00 | 44.5 | 8.1 | 8.1 | 8.1 | False | medium |
| ... | ... | ... | ... | ... | ... | ... |
| 2021-03-13 11:15 | 42.6 | 6.7 | 9.8 | 7.9 | True | high |
| 2021-03-13 11:30 | 42.6 | 6.7 | 9.9 | 7.9 | True | medium |
| 2021-03-13 11:45 | 42.6 | 6.7 | 10.2 | 7.9 | False | medium |
| 2021-03-13 12:00 | 46.5 | 6.7 | 10.3 | 7.9 | True | medium |
| 2021-03-13 12:15 | NaN | 6.6 | 10.3 | 7.9 | False | high |
146 rows × 6 columns
water_vars.loc['2021-03-12 13:00']
discharge             40.8
temperature            7.4
dissolved oxygen      11.6
pH                     8.1
dam release          False
safety level        medium
Name: 2021-03-12 13:00, dtype: object
📝 Check your understanding
Write a line of code to get the row corresponding to March 13th 2021 at 8:00am.
Groupby#
While we have 146 individual readings in our dataset sometimes we don’t care about each individual reading. Instead we probably care about the aggregate of a specific group of readings.
For example:
Given the average temperature of every county in the US, what is the average temperature in each state?
Given a list of the opening dates of every Chuck E Cheese stores, how many Chuck E Cheeses were opened each year? 🧀
In pandas (and tabular data in general) we answer questions like that that with groupby.
Breaking groupby into conceptual parts#
In addition to the dataframe, there are three main parts to a groupby:
Which variable we want to group together
How we want to group
The variable we want to see in the end
Without getting into syntax yet we can start by identifiying these in our two example questions.
Given the average temperature of every county in the US, what is the average temperature in each state?
Which variable to group together? -> We want to group counties into states
How do we want to group? -> Take the average
What variable do we want to look at? Temperature
Given a list of the opening dates of every Chuck E Cheese stores, how many Chuck E Cheeses were opened each year?
Which variable to group together? -> We want to group individual days into years
How do we want to group? -> Count them
What variable do we want to look at? Number of stores
📝 Check your understanding
Identify each of three main groupby parts in the following scenario:
Given the hourly temperatures for a location over the course of a month, what were the daily highs?
Which variable to group together?
How do we want to group?
What variable do we want to look at?
groupby syntax#
We can take these groupby concepts and translate them into syntax. The first two parts (which variable to group & how do we want to group) are required for pandas. The third one is optional.
Starting with just the two required variables, the general syntax is:
DATAFRAME.groupby(WHICH_GROUP).AGGREGATION()
Words in all capitals are variables. We’ll go into each part a little more below.
water_vars.groupby("safety level").min()
| discharge | temperature | dissolved oxygen | pH | dam release | |
|---|---|---|---|---|---|
| safety level | |||||
| high | 40.8 | 6.6 | 8.0 | 7.8 | False |
| low | 39.0 | 6.7 | 8.0 | 7.8 | False |
| medium | 39.0 | 6.7 | 7.9 | 7.8 | False |
'WHICH_GROUP'#
This variable can be any of the columns in the dataframe that can be put into discrete piles. We used 'safety_level' because it can easily be put into piles – low, medium and high.
We are still allowed to group on other columns, it’s just that the practicality can become questionable.
water_vars.groupby("pH").min()
| discharge | temperature | dissolved oxygen | dam release | safety level | |
|---|---|---|---|---|---|
| pH | |||||
| 7.8 | 46.5 | 6.8 | 8.3 | False | high |
| 7.9 | 42.6 | 6.6 | 8.2 | False | high |
| 8.0 | 42.6 | 6.9 | 8.0 | False | high |
| 8.1 | 40.8 | 7.4 | 7.9 | False | high |
| 8.2 | 39.0 | 8.1 | 12.5 | False | high |
Note
Because they are right next to each other it can be really tempting to want to put the variable you are most interested in seeing in place of WHICH_GROUP. If you do this and use a column that can’t be grouped, so consider WHICH_GROUP variable if you are debugging.
Aggregation Functions#
The functions you can use in a groupby are limited, but there are still lots of options. Common ones include:
.count()- find the total number of rows.min()- find the minimum value of those rows.max()- find the maximum value of those rows.mean()- find the mean value of those rows.sum()- find the sum of the values of those rows
The third input#
In the conceptual explanation we often also specify which variable we want to look at. In pandas this isn’t always as important, since by default it gives us the full dataframe. If for some reason we do need to specify the exact variable of interest (ex. we have a very large dataframe, we are making a plot), we do that by adding the column name in after the groupby.
DATAFRAME.groupby(WHICH_GROUP)[INTEREST_VAR].AGGREGATION()
# Group our water dataframe by saftey level and take the mean of the discharge values for each safety level group
water_vars.groupby("safety level")['discharge'].mean()
safety level
high      45.329787
low       44.476364
medium    44.648837
Name: discharge, dtype: float64
📝 Check your understanding
What is the maximum pH value during low safety level?
What is the mean discharge when dam releases are happening?
Breaking down the process#
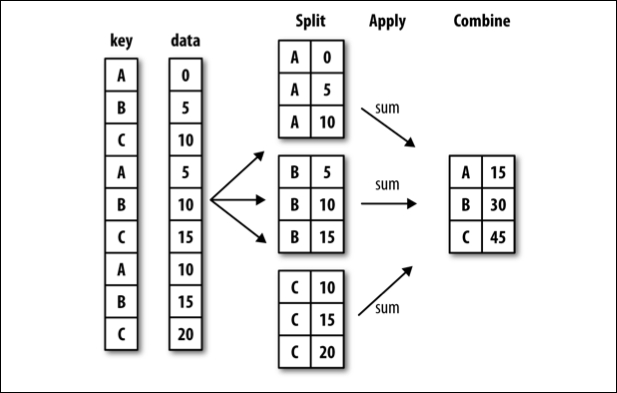
There is a lot that happens in a single step with groupby and it can be a lot to take in. One way to mentally situate this process is to think about split-apply-combine.
split-apply-combine breaks down the groupby process into those three steps:
SPLIT the full data set into groups. Split is related to the question Which variable to group together?
APPLY the aggregation function to the individual groups. Apply is related to the question How do we want to group?
COMBINE the aggregated data into a new dataframe