Starting Computations#
Lesson Content
Dataset
Some computation
Filtering and Masking values
Context#
Yesterday we explored the data structures that xarray uses to organize data. Today we are going to use those datastructres to manipulate data!
import xarray as xr
Dataset#
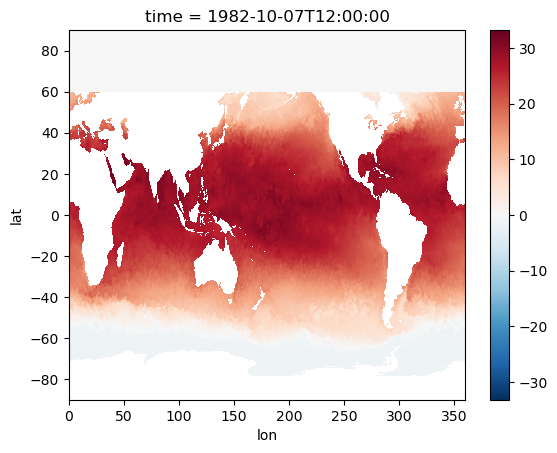
The dataset of the day today is NOAA OISST. It is a sea surface temperature dataset that goes back to the 1980s.
Different from yesterday, where we downloaded a copy of the dataset locally, we will access this data by URL. That means that we won’t be downloading it directly. Instead of giving a filepath on our local computer, we are giving and URL from what is called a THREDDS Catalog, and xarray is able to read that.
sst = xr.open_dataset("https://www.ncei.noaa.gov/thredds/dodsC/OisstBase/NetCDF/V2.1/AVHRR/198210/oisst-avhrr-v02r01.19821007.nc")

sst
<xarray.Dataset>
Dimensions:  (lat: 720, lon: 1440, time: 1, zlev: 1)
Coordinates:
  * lat      (lat) float32 -89.88 -89.62 -89.38 -89.12 ... 89.38 89.62 89.88
  * lon      (lon) float32 0.125 0.375 0.625 0.875 ... 359.1 359.4 359.6 359.9
  * time     (time) datetime64[ns] 1982-10-07T12:00:00
  * zlev     (zlev) float32 0.0
Data variables:
    anom     (time, zlev, lat, lon) float32 ...
    err      (time, zlev, lat, lon) float32 ...
    ice      (time, zlev, lat, lon) float32 ...
    sst      (time, zlev, lat, lon) float32 ...
Attributes: (12/38)
    title:                           NOAA/NCEI 1/4 Degree Daily Optimum Inter...
    source:                          ICOADS, NCEP_GTS, GSFC_ICE, NCEP_ICE, Pa...
    id:                              oisst-avhrr-v02r01.19821007.nc
    naming_authority:                gov.noaa.ncei
    summary:                         NOAAs 1/4-degree Daily Optimum Interpola...
    cdm_data_type:                   Grid
    ...                              ...
    ncei_template_version:           NCEI_NetCDF_Grid_Template_v2.0
    comment:                         Data was converted from NetCDF-3 to NetC...
    sensor:                          Thermometer, AVHRR
    Conventions:                     CF-1.6, ACDD-1.3
    references:                      Reynolds, et al.(2007) Daily High-Resolu...
DODS_EXTRA.Unlimited_Dimension: time📝 Check your understanding
What type of data structure is the sst object? What are the dimensions, how big is each one, and how many variables are there?
Before we go on with our examples for the day, I’m going to do a bit of pre-processing on this data. I’m going to 1) take just the sst DataArray (sst['sst']), 2) get rid of the vertical depth dimension, zlev, since there is just 1 level for sst (the surface).
sst = sst['sst'].squeeze(dim='zlev', drop=True)
Some Computation#
Arithmetic#
sst_kelvin = sst + 273
🌀 More Info: Broadcasting during arithmetic
The reason that this works is because numpy (and therefore xarray) uses a technique called broadcasting. You can read more about it here
Aggregations#
There are a lot (a lot) of built in methods that manipulate data. Some common ones are:
Function |
Description |
|---|---|
|
Maximum |
|
Minimum |
|
Standard deviation |
sst.max()
<xarray.DataArray 'sst' ()>
array(33.21, dtype=float32)
sst.min()
<xarray.DataArray 'sst' ()>
array(-1.8, dtype=float32)
In an earlier lesson we talked about functions/methods as verbs and attributes as adjectives when describing a data object. The methods listed above are examples of these for xarray DataArray objects!
There are a lot of methods for DataArrays. One list (of many on the internet) is here.
Note
One way that programming langauges grow is when people build new tools by starting with the tools that someone else already built. This accelerates progress!
You’ll notice that the link above lists functions that are part of the numpy library. xarray builds on top of numpy, so we can use resources that others have made for numpy to help us with xarray. While not every numpy function, a lot of the numpy functions are available for xarray.
📝 Check your understanding
What is the mean value of the sst DataArray?
Reading documentation#
To practice looking at documentation, let’s look at the docs page for the xarray.DataArray.max() method.
We notice a few optional arguments - dim and axis. dim takes an integer as an argument and axis takes a string. Let’s try them out.
sst.max(axis=2)
<xarray.DataArray 'sst' (time: 1, lat: 720)>
array([[            nan,             nan,             nan,
                    nan,             nan,             nan,
                    nan,             nan,             nan,
                    nan,             nan,             nan,
                    nan,             nan,             nan,
                    nan,             nan,             nan,
                    nan,             nan,             nan,
                    nan,             nan,             nan,
                    nan,             nan,             nan,
                    nan,             nan,             nan,
                    nan,             nan,             nan,
                    nan,             nan,             nan,
                    nan,             nan,             nan,
                    nan,             nan,             nan,
                    nan,             nan,             nan,
                    nan, -1.30999994e+00, -1.32999992e+00,
        -1.36000001e+00, -1.36000001e+00, -1.38000000e+00,
        -1.15999997e+00, -1.07999992e+00, -1.10000002e+00,
        -1.02999997e+00, -1.22000003e+00, -1.33999991e+00,
        -1.33999991e+00, -1.36000001e+00, -1.32999992e+00,
...
         7.00000000e+00,  6.34999990e+00,  5.42000008e+00,
         5.27999973e+00,  5.30999994e+00,  5.38999987e+00,
         4.42999983e+00,  3.74000001e+00,  3.42999983e+00,
         3.13999987e+00,  3.01999998e+00,  2.95000005e+00,
         3.09999990e+00,  3.52999997e+00,  3.51999998e+00,
         3.34999990e+00,  3.24000001e+00,  2.88999987e+00,
         2.49000001e+00,  2.54999995e+00,  1.89999998e+00,
         1.14999998e+00,  1.05999994e+00,  7.99999952e-01,
         4.29999977e-01,  9.99999978e-03, -2.09999993e-01,
        -3.59999985e-01, -4.79999989e-01, -5.50000012e-01,
        -6.39999986e-01, -6.99999988e-01, -7.29999959e-01,
        -7.59999990e-01, -7.50000000e-01, -7.19999969e-01,
        -6.99999988e-01, -6.89999998e-01, -6.80000007e-01,
        -6.80000007e-01, -7.29999959e-01, -7.79999971e-01,
        -8.19999993e-01, -8.59999955e-01, -8.99999976e-01,
        -9.39999998e-01, -9.69999969e-01, -1.00000000e+00,
        -1.02999997e+00, -1.05999994e+00, -1.07999992e+00,
        -1.10000002e+00, -1.12000000e+00, -1.13999999e+00,
        -1.14999998e+00, -1.16999996e+00, -1.17999995e+00,
        -1.17999995e+00, -1.18999994e+00, -1.18999994e+00]], dtype=float32)
Coordinates:
  * lat      (lat) float32 -89.88 -89.62 -89.38 -89.12 ... 89.38 89.62 89.88
* time (time) datetime64[ns] 1982-10-07T12:00:00sst.max(dim='lat')
<xarray.DataArray 'sst' (time: 1, lon: 1440)>
array([[25.96    , 25.99    , 26.029999, ..., 26.17    , 26.099998,
        26.029999]], dtype=float32)
Coordinates:
  * lon      (lon) float32 0.125 0.375 0.625 0.875 ... 359.1 359.4 359.6 359.9
* time (time) datetime64[ns] 1982-10-07T12:00:00We see that when we use these arguments instead of smushing the all the data together and taking the maximum value, we are taking the maximum value along a particular axis of data. Whatever axis we specify in the argument disappears after we take the maximum.
Note
While we won’t cover it here, you can use this paradigm of applying a function on a full dataset or along an axis almost indefinetly in xarray. Even if the function you want to apply isn’t a built-in function (maybe it’s an algorithm you wrote yourself!), you can apply it using DataArray.reduce().
📝 Check your understanding
Look at the documentation page for the .std() function in xarray and the documentation page for .std() in numpy.
What does the function do? (Use the numpy page)
Name 1 argument to the function and describe what it does.
What type of object does the function return?
Filtering or masking values#
Let’s start by looking at how we use booleans with data arrays. We saw previously how we could take single values and compare them with comparisons.
# mask the values with ice or err set
7 < 10
True
x = 'hello'
x == 'hola'
False
Can we make boolean comparisons with xarray data? Turns out we can! We can use the same comparisons (>, <, ==, >=, <=), and it compares every value in the DataArray.
# import numpy as np

# np.printoptions(threshold=20)
# xr.set_options(display_expand_data=True)
sst > 15
<xarray.DataArray 'sst' (time: 1, lat: 720, lon: 1440)>
array([[[False, False, False, ..., False, False, False],
        [False, False, False, ..., False, False, False],
        [False, False, False, ..., False, False, False],
        ...,
        [False, False, False, ..., False, False, False],
        [False, False, False, ..., False, False, False],
        [False, False, False, ..., False, False, False]]])
Coordinates:
  * lat      (lat) float32 -89.88 -89.62 -89.38 -89.12 ... 89.38 89.62 89.88
  * lon      (lon) float32 0.125 0.375 0.625 0.875 ... 359.1 359.4 359.6 359.9
* time (time) datetime64[ns] 1982-10-07T12:00:00What did we get? An array of the same size where each value is a boolean True/False telling us if the condition was true.
We can even use and and or like we talked about earlier in the week, but we have to change the syntax:
and ->
&or ->
|
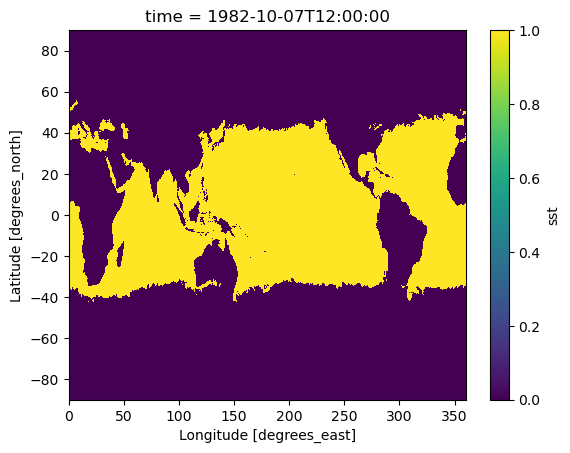
(sst > 15) & (sst < 20)
<xarray.DataArray 'sst' (time: 1, lat: 720, lon: 1440)>
array([[[False, False, False, ..., False, False, False],
        [False, False, False, ..., False, False, False],
        [False, False, False, ..., False, False, False],
        ...,
        [False, False, False, ..., False, False, False],
        [False, False, False, ..., False, False, False],
        [False, False, False, ..., False, False, False]]])
Coordinates:
* lat (lat) float32 -89.88 -89.62 -89.38 -89.12 ... 89.38 89.62 89.88
* lon (lon) float32 0.125 0.375 0.625 0.875 ... 359.1 359.4 359.6 359.9
* time (time) datetime64[ns] 1982-10-07T12:00:00(sst > 15).isel(time=0).plot()
<matplotlib.collections.QuadMesh at 0x166911060>
📝 Check your understanding
Create a plot that shows where sst is above 10 degrees.
Masking values with xr.where()
Another common kind of data manipulation is to want to give data cells new values based on their old values. For that we will use xr.where().
xr.where() takes at least three arguments:
xr.where(condition, true, false)
conditionshould be any type of boolean statement like above that returns a bunch of True/Falsetrueis what xarray should put into any place that has a True value.
Optionally, you can also add a third argument describing what would happen should happen to the places where the condition array is False.
Note better to go with the method version of .where ? https://xarray.pydata.org/en/v2022.03.0/generated/xarray.Dataset.where.html
In this example, we see that anywhere that sst is greater than 20, xarray will put the word “warm”. All other places it will put the word “cold”.
xr.where(sst > 20, "warm", "cold")
<xarray.DataArray 'sst' (time: 1, lat: 720, lon: 1440)>
array([[['cold', 'cold', 'cold', ..., 'cold', 'cold', 'cold'],
        ['cold', 'cold', 'cold', ..., 'cold', 'cold', 'cold'],
        ['cold', 'cold', 'cold', ..., 'cold', 'cold', 'cold'],
        ...,
        ['cold', 'cold', 'cold', ..., 'cold', 'cold', 'cold'],
        ['cold', 'cold', 'cold', ..., 'cold', 'cold', 'cold'],
        ['cold', 'cold', 'cold', ..., 'cold', 'cold', 'cold']]],
      dtype='<U4')
Coordinates:
  * lat      (lat) float32 -89.88 -89.62 -89.38 -89.12 ... 89.38 89.62 89.88
  * lon      (lon) float32 0.125 0.375 0.625 0.875 ... 359.1 359.4 359.6 359.9
* time (time) datetime64[ns] 1982-10-07T12:00:00import numpy as np
xr.where(sst < 0, np.nan, sst)
<xarray.DataArray 'sst' (time: 1, lat: 720, lon: 1440)>
array([[[nan, nan, nan, ..., nan, nan, nan],
        [nan, nan, nan, ..., nan, nan, nan],
        [nan, nan, nan, ..., nan, nan, nan],
        ...,
        [nan, nan, nan, ..., nan, nan, nan],
        [nan, nan, nan, ..., nan, nan, nan],
        [nan, nan, nan, ..., nan, nan, nan]]], dtype=float32)
Coordinates:
  * lat      (lat) float32 -89.88 -89.62 -89.38 -89.12 ... 89.38 89.62 89.88
  * lon      (lon) float32 0.125 0.375 0.625 0.875 ... 359.1 359.4 359.6 359.9
* time (time) datetime64[ns] 1982-10-07T12:00:00Notice that the conditional doesn’t have to be data from the original dataset - it could be one of its coordinates, or even a totally different dataset of the same shape.
masked = xr.where(sst.lat > 60, 0, sst)
masked.isel(time=0).plot()
<matplotlib.collections.QuadMesh at 0x166a63b50>