Mapping with cartopy and Colors#
Context#
Yesterday we explored the exciting world of combining geospatial information with our pandas dataframe in the context of analysis and computations. Today we are going to now see what we can do with visualization when we have geospatial information. We are going to use the library cartopy to make maps and we will also explore some more visualization features of matplotlib.
Today are going to use a geodataframe of the NAAMES dataset.
import pandas as pd
import geopandas as gpd
import numpy as np
naames = pd.read_csv('./data/naames-mrg01-c130_merge_20151112_R5_thru20151114.csv', skiprows=223)
# Filter down to just 1 day
naames = naames[naames[' Fractional_Day'] < 317]
# Remove NaN values
naames = naames.replace({-999999: np.nan})
# Create geodataframe
naames_gpd = gpd.GeoDataFrame(naames,
                            geometry=gpd.points_from_xy(naames[' LONGITUDE'], naames[' LATITUDE']),
                            crs='epsg:4326')
cartopy#
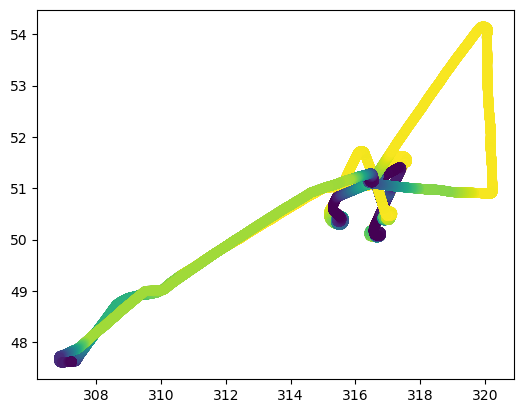
Yesterday we saw that for a quick visual we could use the .plot() function to look at our data on a latitude/longitude axis. This is nice and it is easy, but we lack context in this simplified view.
naames_gpd.plot(column=' ALTP')
<Axes: >
To expand our map we are going to use cartopy. Some advantages of cartopy are:
ability to reproject a dataset
ability to plot data from different projections together
ability to add features such as coastlines below your data, similar to a basemap
Let’s see an example of using cartopy by re-creating the map above with some features below.
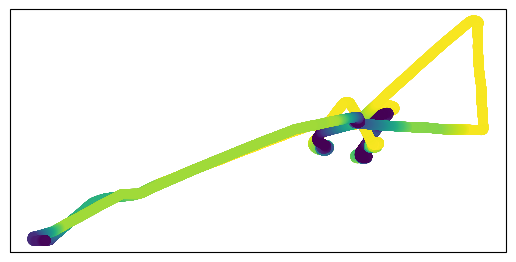
cartopy builds into the matplotlib OOP interface, so let’s start by creating a map with matplotlib OOP.
import matplotlib.pyplot as plt
fig = plt.figure()
ax = plt.axes()

naames_gpd.plot(ax=ax, column=' ALTP')
<Axes: >
Now the plot above doesn’t use cartopy, it’s just the same map as the geopandas version but plotted in a different way. To change to using cartopy we have to:
define our crs
convert our geopandas dataframe to that crs
add the crs as an argument to
plt.axes()
The CRS we are going to use is called PlateCarree.
import cartopy.crs as ccrs
# Create the projection
crs = ccrs.PlateCarree()

# This can be converted into a `proj4` string/dict compatible with GeoPandas
naames_platecarree = naames_gpd.to_crs(crs.proj4_init)
# Recreate the plot with the projection as an argument
fig = plt.figure()
ax = plt.axes(projection=crs)

naames_platecarree.plot(ax=ax, column=' ALTP')
<GeoAxes: >
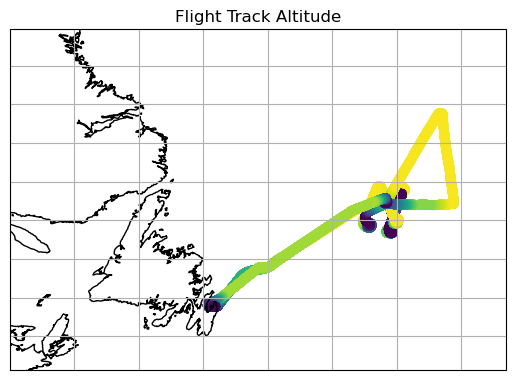
So far it looks like we’ve taken a step backwards because we have lost our nice axis labels. We can add those back, however, using the .gridlines() method. Additionally, we can use the .coastlines() feature to add in the shape of the nearby continent. I’m also going to use .set_extent() to give us a bit broader view and a title for clarity.
# Recreate the plot with the projection as an argument
fig = plt.figure()
ax = plt.axes(projection=crs)

# Add the data
naames_platecarree.plot(ax=ax, column=' ALTP')

# Change the field of view
ax.set_extent([-63, -38, 45, 57])
# Add labels and gridlines
ax.gridlines(crs=crs, draw_labels=True)
# Add the shape of the coast
ax.coastlines()

# Add a title
ax.set_title('Flight Track Altitude')
Text(0.5, 1.0, 'Flight Track Altitude')
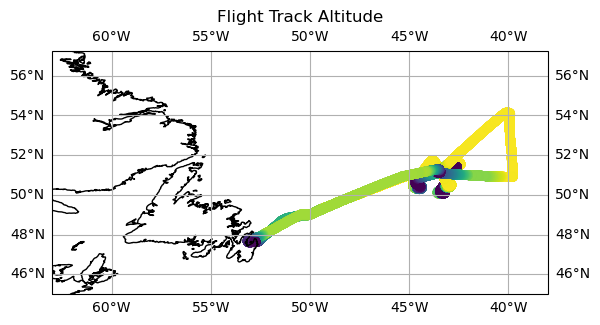
Looks nice! So with a bit of extra work we have converted out quick geopandas plot into a map with nice labels, gridlines and coastlines.
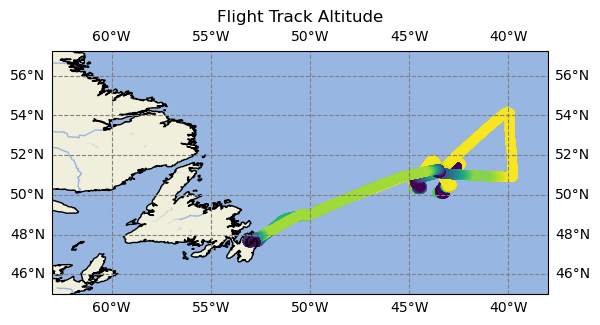
cartopy Features#
One of the nice built-in features of cartopy is that it can download and render features layers such as coastlines, rivers, and some political boundaries on your map. The example below shows how to use features with the pre-built cartopy features. This example also shows how to create a custom feature.
import cartopy.feature as cfeature
# Recreate the plot with the projection as an argument
fig = plt.figure()
ax = plt.axes(projection=crs)

# Add the data
naames_platecarree.plot(ax=ax, column=' ALTP')

# Change the field of view
ax.set_extent([-63, -38, 45, 57])
# Add labels and gridlines
ax.gridlines(crs=crs, color='grey', linestyle='--', draw_labels=True)

# Add background features
ax.add_feature(cfeature.LAND)
ax.add_feature(cfeature.OCEAN)
ax.add_feature(cfeature.COASTLINE)
ax.add_feature(cfeature.BORDERS, linestyle=':')
ax.add_feature(cfeature.LAKES, alpha=0.5)
ax.add_feature(cfeature.RIVERS)

# Add a title
ax.set_title('Flight Track Altitude')
Text(0.5, 1.0, 'Flight Track Altitude')
Transforming Data#
One of the nice parts of cartopy is that it lets you change your projection farily easily. To do this we will define a different starting projection, then run the same code again.
# Create the projection
crs = ccrs.AlbersEqualArea(-50, 52)

# This can be converted into a `proj4` string/dict compatible with GeoPandas
naames_albers = naames_gpd.to_crs(crs.proj4_init)
# Recreate the plot with the projection as an argument
fig = plt.figure()
ax = plt.axes(projection=crs)

# Add the data
naames_albers.plot(ax=ax, column=' ALTP')

# Change the field of view
ax.set_extent([-63, -38, 45, 57])
# Add labels and gridlines
ax.gridlines(crs=crs)
# Add the shape of the coast
ax.coastlines()

# Add a title
ax.set_title('Flight Track Altitude')
Text(0.5, 1.0, 'Flight Track Altitude')
There are lots of projections and which one you want depends on where in the world you are. A full list of projections can be found here.
For flight track data the change in projection likely won’t matter very much. Where this feature becomes useful is if you are plotting two data sources with different starting projections. If that is the case then we can use these features to convert the different sources to the same projection.
Color in matplotlib#
There are a variety of ways to deal with color and colorbars in matplotlib.
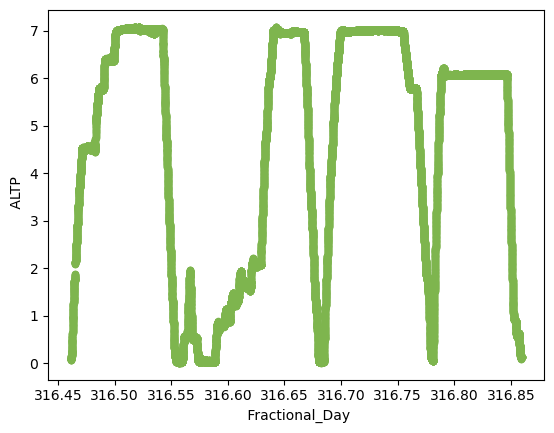
Firstly, color can be specified in several ways. When specifying a single color you can use RGB, hexadecimal, or sometimes by a written name. A full list of the options is in the docs. Another useful tool is an online color picker. There are dozens of these available so try a couple to find your favorite. One I have used before is the W3Schools Color Picker.
naames.plot.scatter(x=' Fractional_Day', y=' ALTP', c='#7eb54e')  # hexadecimal color code
# naames.plot.scatter(x=' Fractional_Day', y=' ALTP', c=(0.49, 0.75, 0.97))  # RGB color code
<Axes: xlabel=' Fractional_Day', ylabel=' ALTP'>
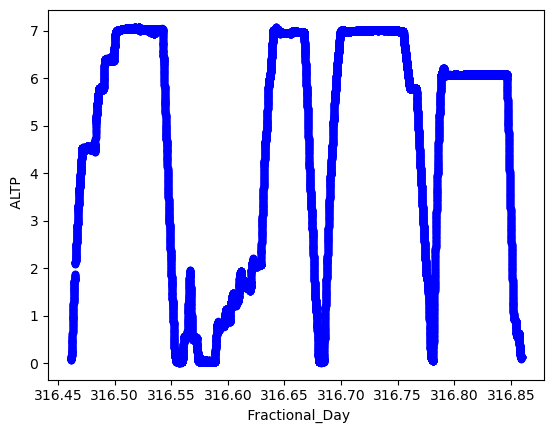
naames.plot.scatter(x=' Fractional_Day', y=' ALTP', c='blue')
<Axes: xlabel=' Fractional_Day', ylabel=' ALTP'>
We have also seen that you can use another column to create the color for a scatter plot.
naames.plot.scatter(x=' Fractional_Day', y=' ALTP', c=' BC_mass')
<Axes: xlabel=' Fractional_Day', ylabel=' ALTP'>
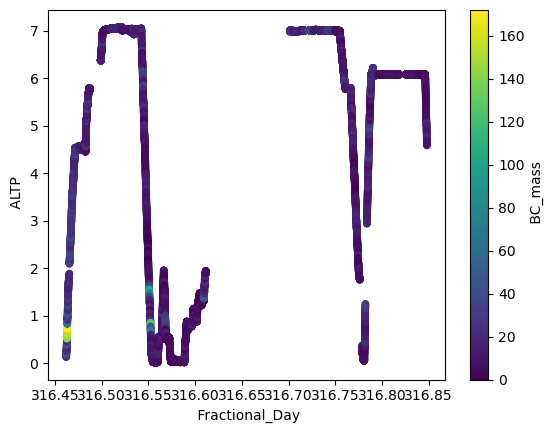
Adding a color-based legend to a plot is called adding a colorbar. When adding a colorbar there are multiple components:
The values that are used to determine the color at that point
The colors that are going to be used for the range of values These two things are two seperate inputs,
cfor the first one, andcmapfor the second one.
# _r on the colormap reverses. So viridis and viridis_r both work
naames.plot.scatter(x=' Fractional_Day', y=' ALTP', c=' BC_mass', colormap='viridis')
<Axes: xlabel=' Fractional_Day', ylabel=' ALTP'>
A list of the available colormaps can be found here.
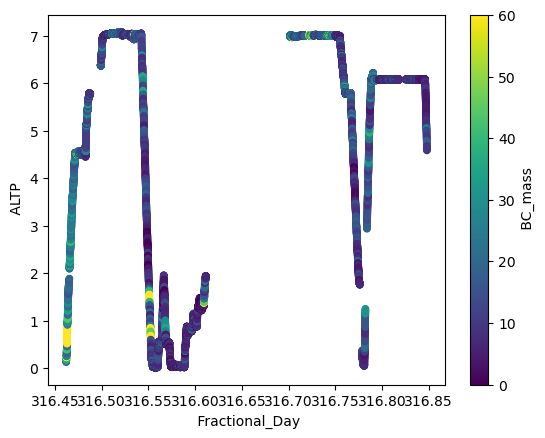
A common parameter you may want to access are vmax and vmin. These don’t change the values in your dataset, but they do change the which values correspond to which colors in your colormap.
naames.plot.scatter(x=' Fractional_Day', y=' ALTP', c=' BC_mass', colormap='viridis', vmax=60)
<Axes: xlabel=' Fractional_Day', ylabel=' ALTP'>
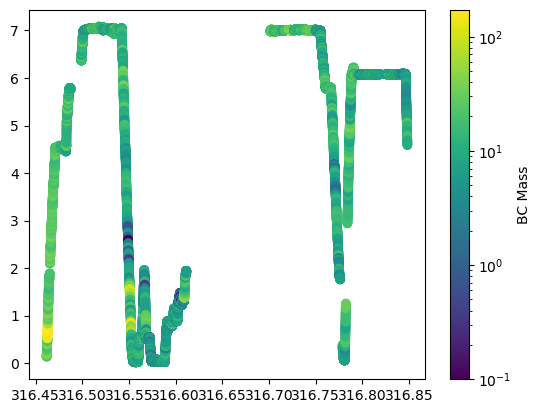
It is possible to have your colorbar have a log colormap, you just have to switch into matplotlib.
import matplotlib.colors
plt.scatter(naames[' Fractional_Day'], naames[' ALTP'], c=naames[' BC_mass'],
                    cmap='viridis', norm=matplotlib.colors.LogNorm())

plt.colorbar(label='BC Mass')
<matplotlib.colorbar.Colorbar at 0x16db227a0>
Code Summary#
Preprocessing#
import pandas as pd
import geopandas as gpd
import numpy as np
import matplotlib.pyplot as plt
naames = pd.read_csv('./data/naames-mrg01-c130_merge_20151112_R5_thru20151114.csv', skiprows=223)
# Filter down to just 1 day
naames = naames[naames[' Fractional_Day'] < 317]
# Remove NaN values
naames = naames.replace({-999999: np.nan})
# Create geodataframe
naames_gpd = gpd.GeoDataFrame(naames,
                            geometry=gpd.points_from_xy(naames[' LONGITUDE'], naames[' LATITUDE']),
                            crs='epsg:4326')
Mapping#
Using geopandas#
fig = plt.figure()
ax = plt.axes()

naames_gpd.plot(ax=ax, column=' ALTP')
<Axes: >
Using cartopy#
# Recreate the plot with the projection as an argument
fig = plt.figure()
ax = plt.axes(projection=crs)

# Add the data
naames_platecarree.plot(ax=ax, column=' ALTP')

# Change the field of view
ax.set_extent([-63, -38, 45, 57])
# Add labels and gridlines
# ax.gridlines(crs=crs, color='grey', linestyle='--', draw_labels=True)

# Add background features
ax.add_feature(cfeature.LAND)
ax.add_feature(cfeature.OCEAN)
ax.add_feature(cfeature.COASTLINE)
ax.add_feature(cfeature.BORDERS, linestyle=':')
ax.add_feature(cfeature.LAKES, alpha=0.5)
ax.add_feature(cfeature.RIVERS)

# Add a title
ax.set_title('Flight Track Altitude')
Text(0.5, 1.0, 'Flight Track Altitude')
Error in callback <function _draw_all_if_interactive at 0x162967f40> (for post_execute):
---------------------------------------------------------------------------
KeyboardInterrupt                         Traceback (most recent call last)
File ~/miniconda3/envs/sarp/lib/python3.10/site-packages/matplotlib/pyplot.py:120, in _draw_all_if_interactive()
    118 def _draw_all_if_interactive():
    119     if matplotlib.is_interactive():
--> 120         draw_all()

File ~/miniconda3/envs/sarp/lib/python3.10/site-packages/matplotlib/_pylab_helpers.py:132, in Gcf.draw_all(cls, force)
    130 for manager in cls.get_all_fig_managers():
    131     if force or manager.canvas.figure.stale:
--> 132         manager.canvas.draw_idle()

File ~/miniconda3/envs/sarp/lib/python3.10/site-packages/matplotlib/backend_bases.py:2082, in FigureCanvasBase.draw_idle(self, *args, **kwargs)
   2080 if not self._is_idle_drawing:
   2081     with self._idle_draw_cntx():
-> 2082         self.draw(*args, **kwargs)

File ~/miniconda3/envs/sarp/lib/python3.10/site-packages/matplotlib/backends/backend_agg.py:400, in FigureCanvasAgg.draw(self)
    396 # Acquire a lock on the shared font cache.
    397 with RendererAgg.lock, \
    398      (self.toolbar._wait_cursor_for_draw_cm() if self.toolbar
    399       else nullcontext()):
--> 400     self.figure.draw(self.renderer)
    401     # A GUI class may be need to update a window using this draw, so
    402     # don't forget to call the superclass.
    403     super().draw()

File ~/miniconda3/envs/sarp/lib/python3.10/site-packages/matplotlib/artist.py:95, in _finalize_rasterization.<locals>.draw_wrapper(artist, renderer, *args, **kwargs)
     93 @wraps(draw)
     94 def draw_wrapper(artist, renderer, *args, **kwargs):
---> 95     result = draw(artist, renderer, *args, **kwargs)
     96     if renderer._rasterizing:
     97         renderer.stop_rasterizing()

File ~/miniconda3/envs/sarp/lib/python3.10/site-packages/matplotlib/artist.py:72, in allow_rasterization.<locals>.draw_wrapper(artist, renderer)
     69     if artist.get_agg_filter() is not None:
     70         renderer.start_filter()
---> 72     return draw(artist, renderer)
     73 finally:
     74     if artist.get_agg_filter() is not None:

File ~/miniconda3/envs/sarp/lib/python3.10/site-packages/matplotlib/figure.py:3175, in Figure.draw(self, renderer)
   3172         # ValueError can occur when resizing a window.
   3174 self.patch.draw(renderer)
-> 3175 mimage._draw_list_compositing_images(
   3176     renderer, self, artists, self.suppressComposite)
   3178 for sfig in self.subfigs:
   3179     sfig.draw(renderer)

File ~/miniconda3/envs/sarp/lib/python3.10/site-packages/matplotlib/image.py:131, in _draw_list_compositing_images(renderer, parent, artists, suppress_composite)
    129 if not_composite or not has_images:
    130     for a in artists:
--> 131         a.draw(renderer)
    132 else:
    133     # Composite any adjacent images together
    134     image_group = []

File ~/miniconda3/envs/sarp/lib/python3.10/site-packages/matplotlib/artist.py:72, in allow_rasterization.<locals>.draw_wrapper(artist, renderer)
     69     if artist.get_agg_filter() is not None:
     70         renderer.start_filter()
---> 72     return draw(artist, renderer)
     73 finally:
     74     if artist.get_agg_filter() is not None:

File ~/miniconda3/envs/sarp/lib/python3.10/site-packages/cartopy/mpl/geoaxes.py:538, in GeoAxes.draw(self, renderer, **kwargs)
    533         self.imshow(img, extent=extent, origin=origin,
    534                     transform=factory.crs, *factory_args[1:],
    535                     **factory_kwargs)
    536 self._done_img_factory = True
--> 538 return super().draw(renderer=renderer, **kwargs)

File ~/miniconda3/envs/sarp/lib/python3.10/site-packages/matplotlib/artist.py:72, in allow_rasterization.<locals>.draw_wrapper(artist, renderer)
     69     if artist.get_agg_filter() is not None:
     70         renderer.start_filter()
---> 72     return draw(artist, renderer)
     73 finally:
     74     if artist.get_agg_filter() is not None:

File ~/miniconda3/envs/sarp/lib/python3.10/site-packages/matplotlib/axes/_base.py:3064, in _AxesBase.draw(self, renderer)
   3061 if artists_rasterized:
   3062     _draw_rasterized(self.figure, artists_rasterized, renderer)
-> 3064 mimage._draw_list_compositing_images(
   3065     renderer, self, artists, self.figure.suppressComposite)
   3067 renderer.close_group('axes')
   3068 self.stale = False

File ~/miniconda3/envs/sarp/lib/python3.10/site-packages/matplotlib/image.py:131, in _draw_list_compositing_images(renderer, parent, artists, suppress_composite)
    129 if not_composite or not has_images:
    130     for a in artists:
--> 131         a.draw(renderer)
    132 else:
    133     # Composite any adjacent images together
    134     image_group = []

File ~/miniconda3/envs/sarp/lib/python3.10/site-packages/matplotlib/artist.py:72, in allow_rasterization.<locals>.draw_wrapper(artist, renderer)
     69     if artist.get_agg_filter() is not None:
     70         renderer.start_filter()
---> 72     return draw(artist, renderer)
     73 finally:
     74     if artist.get_agg_filter() is not None:

File ~/miniconda3/envs/sarp/lib/python3.10/site-packages/cartopy/mpl/feature_artist.py:185, in FeatureArtist.draw(self, renderer, *args, **kwargs)
    183 if geom_paths is None:
    184     if ax.projection != feature_crs:
--> 185         projected_geom = ax.projection.project_geometry(
    186             geom, feature_crs)
    187     else:
    188         projected_geom = geom

File ~/miniconda3/envs/sarp/lib/python3.10/site-packages/cartopy/crs.py:808, in Projection.project_geometry(self, geometry, src_crs)
    806 if not method_name:
    807     raise ValueError(f'Unsupported geometry type {geom_type!r}')
--> 808 return getattr(self, method_name)(geometry, src_crs)

File ~/miniconda3/envs/sarp/lib/python3.10/site-packages/cartopy/crs.py:924, in Projection._project_multipolygon(self, geometry, src_crs)
    922 geoms = []
    923 for geom in geometry.geoms:
--> 924     r = self._project_polygon(geom, src_crs)
    925     if r:
    926         geoms.extend(r.geoms)

File ~/miniconda3/envs/sarp/lib/python3.10/site-packages/cartopy/crs.py:951, in Projection._project_polygon(self, polygon, src_crs)
    949 multi_lines = []
    950 for src_ring in [polygon.exterior] + list(polygon.interiors):
--> 951     p_rings, p_mline = self._project_linear_ring(src_ring, src_crs)
    952     if p_rings:
    953         rings.extend(p_rings)

File ~/miniconda3/envs/sarp/lib/python3.10/site-packages/cartopy/crs.py:827, in Projection._project_linear_ring(self, linear_ring, src_crs)
    822 debug = False
    823 # 1) Resolve the initial lines into projected segments
    824 # 1abc
    825 # def23ghi
    826 # jkl41
--> 827 multi_line_string = cartopy.trace.project_linear(linear_ring,
    828                                                  src_crs, self)
    830 # Threshold for whether a point is close enough to be the same
    831 # point as another.
    832 threshold = max(np.abs(self.x_limits + self.y_limits)) * 1e-5

File lib/cartopy/trace.pyx:600, in cartopy.trace.project_linear()

File lib/cartopy/trace.pyx:477, in cartopy.trace._project_segment()

File lib/cartopy/trace.pyx:184, in cartopy.trace.Interpolator.project()

File ~/miniconda3/envs/sarp/lib/python3.10/site-packages/pyproj/transformer.py:820, in Transformer.transform(self, xx, yy, zz, tt, radians, errcheck, direction, inplace)
    727 """
    728 Transform points between two coordinate systems.
    729
   (...)
    816
    817 """
    818 try:
    819     # function optimized for point data
--> 820     return self._transformer._transform_point(
    821         inx=xx,
    822         iny=yy,
    823         inz=zz,
    824         intime=tt,
    825         direction=direction,
    826         radians=radians,
    827         errcheck=errcheck,
    828     )
    829 except TypeError:
    830     pass

File ~/miniconda3/envs/sarp/lib/python3.10/site-packages/pyproj/transformer.py:348, in Transformer._transformer(self)
    345     self._local = TransformerLocal()
    346     self._local.transformer = self._transformer_maker()
--> 348 @property
    349 def _transformer(self):
    350     """
    351     The Cython _Transformer object for this thread.
    352
   (...)
    355     _Transformer
    356     """
    357     if self._local.transformer is None:

KeyboardInterrupt: